What LTSS benefits are MA plans covering in 2020, and how are LTSS costs increasing?
Introduction
The Centers for Medicare and Medicaid Services (CMS) revised the definition of “primarily health related"1 (PHR) benefits so that, for Medicare Advantage (MA), organizations could offer expanded supplemental services beginning in 2019. These services are often used by individuals with chronic conditions in need of long-term services and supports (LTSS). Many of these services are the same that private long-term care (LTC) insurance covers and reimburses.
In 2020, MA plans may offer a “non-primarily health related” item or service to chronically ill enrollees if the benefit has a reasonable expectation of improving and maintaining the health or overall function of the chronically ill enrollee. These benefits are called special supplemental benefits for the chronically ill (SSBCI). Eligibility for SSBCI is determined by the plan based on a three-pronged definition of a chronically ill enrollee2 as an individual who:
- Has one or more comorbid and medically complex chronic conditions that are life-threatening or significantly limit the overall health or function of the enrollee
- Has a high risk of hospitalization or other adverse health outcomes
- Requires intensive care coordination
This article addresses how the MA marketplace responded in 2020 to the expansion of supplemental benefits. We will compare the availability of primarily health-related services in the market for 2020 to that in 2019 and evaluate the MA plans' offerings of SSBCI in 2020, including which supplemental benefits that plans are offering and where these benefits are offered. We discuss the demand and costs for LTSS-type services among the elderly and the challenges that MA plans may face in developing these benefits.
2020 supplemental benefits under the expanded PHR definition
CMS initially presented nine possible supplemental benefits that plans could offer in 2019 under the expanded PHR definition. We surveyed the approved MA benefit information for all organizations that submitted a calendar year (CY) 2020 bid, as published in CMS.gov,3 and identified an increase in the offering of some of these supplemental benefits in 2020.4 Our assessment excludes dual eligible plans as these plans could offer some of these benefits prior to the supplemental benefit expansion.
Figure 1 reflects the count of plans offering these benefits in 2020, excluding dual eligible plans, compared to the 2019 plan counts for the same benefits. Other potential PHR expansion benefits still being offered through benefit 13 of the plan benefit package (PBP) tool are excluded from our assessment (see footnote 4).
Many of the services in Figure 1 (such as “adult day care services” and “respite care”) are LTSS-type services that qualify under the PHR benefit expansion. In total, we found 351 different MA plans that offer LTSS-type benefits in 2020. Please refer to Figure 2 for a breakdown of the unique plans offering these types of benefits by plan type and by network. We were also able to identify that approximately 50% of these are premium-paying plans.
Figure 1: MA Plans Offering Benefits Under the Expanded PHR Definition*
| PHR Supplemental benefit | CY2020 | CY2019 |
|---|---|---|
| Adult day care services | 63 | 0 |
| Home-based palliative care | 58 | 29 |
| In-home support services | 148 | 51 |
| Support for caregivers (aka respite care) | 77 | N/A** |
| Therapeutic massage | 180 | 22 |
| Total (several plans offer more than one benefit in 2020) | 351 | 102 |
| * CY2020 plan counts per benefit 14c of the PBP. CY2019 plan counts per benefit b13 of PBP tool. | ||
| ** Support for caregivers was classified differently in CY2019. | ||
Figure 2: 2020 MA Plans Offering LTSS-Type Benefits, Unique Plan Count by Plan Type
| Network / Plan Type | Non-Special Needs Plans | Chronic or Disabling Condition SNP | Institutional SNP | Total |
|---|---|---|---|---|
| HMO | 242 | 36 | 4 | 282 |
| HMO-POS | 28 | 4 | 0 | 32 |
| LPPO | 37 | 0 | 0 | 37 |
| RPPO | 0 | 0 | 0 | 0 |
| Total | 307 | 40 | 4 | 351 |
| Note: HMO = health maintenance organization, LPPO = local preferred provider organization, HMO-POS = HMO with place-of-service benefit, RPPO = regional preferred provider organization | ||||
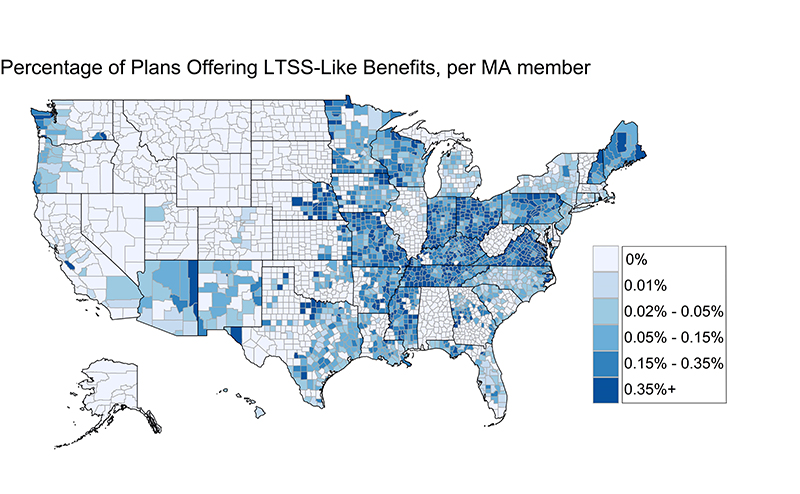
We show next where these plans are concentrated nationwide via a heat map of the United States. Figure 3 highlights which counties have the most MA plans with LTSS-type benefits. Figure 4 shows the counties with the highest density of plans offering LTSS-type benefits for each MA-enrolled member as of January 2019.
Some states, such as Maine, New Hampshire, Ohio, Pennsylvania, Rhode Island, Tennessee, and Virginia, are offering plans with LTSS-type benefits in all counties. Some of the more populated states, such as California, Florida, and Texas, contain areas with higher amounts of LTSS-type benefits, such as Los Angeles in California and Miami-Dade in Florida.
We are seeing many states increase the number of plans offering LTSS-type benefits (notably Ohio and Pennsylvania) since our analysis last year. We also note that the saturation of counties offering these benefits is increasing along the Rust Belt and West Coast states.
Figure 3: MA Plans Offering LTSS-Type Benefits in 2019, Count by County
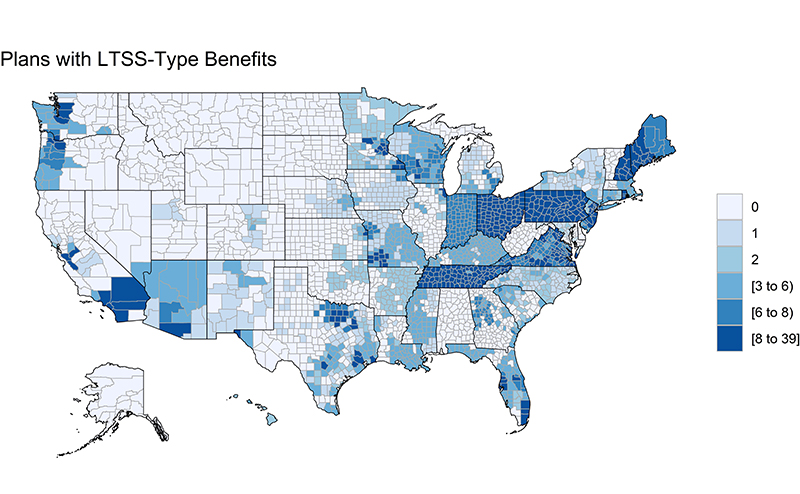
Figure 4: Density of MA Plans With LTSS-Type Benefits: Plans Offering LTSS-Type Benefits per MA Member in 2019, Within Each County
2020 supplemental benefits for the chronically ill
CMS provides a non-exhaustive list of examples of non-PHR SSBCI. We surveyed the approved MA benefit information for all organizations that submitted CY2020 bids, as published in CMS.gov,5 and have summarized information regarding the plans that added benefits under this new guidance in Figure 5.
Figure 5: SSBCI Benefits Offered in CY2020 MA Plans
| Supplemental benefits for the chronically ill* | Not SNP | Dual Eligible | Chronic or Disabling Condition | Institutional | Total |
|---|---|---|---|---|---|
| Food and Produce | 63 | 26 | 11 | 1 | 101 |
| Meals (beyond limited basis) | 40 | 7 | 24 | 0 | 71 |
| Pest Control | 86 | 20 | 12 | 0 | 118 |
| Transport for Non-Medical Needs | 60 | 16 | 7 | 5 | 88 |
| Indoor Air Quality Equipment and Services | 50 | 2 | 0 | 0 | 52 |
| Social Needs Benefits | 21 | 6 | 2 | 5 | 34 |
| Complementary Therapies | 1 | 0 | 0 | 0 | 1 |
| Services Supporting Self-Direction | 16 | 3 | 1 | 0 | 20 |
| Structural Home Modification | 43 | 1 | 0 | 0 | 44 |
| Transitional/Temporary Support | 52 | 7 | 8 | 0 | 67 |
| Service Dog | 30 | 18 | 3 | 0 | 51 |
| Total | 462 | 106 | 68 | 11 | 647 |
| * Note: In some cases, more than one SSBCI is offered within an MA plan. | |||||
A total of 245 different MA plans in 30 states (including Puerto Rico) added SSBCI benefits to their CY2020 product offerings. Roughly half of them (50.2%) are premium-paying plans. The vast majority are health maintenance organization (HMO) type plans. Refer to Figure 6 for an overview of the plans offering these benefits in 2020 by plan type.
Figure 6: 2020 MA Plans Offering SSBCI Benefits, Unique Plan Count by Plan Type
| Network/Plan Type | Non-Special Needs | Dual Eligible | Chronic or Disabling Condition SNP | Institutional SNP | Total | |
|---|---|---|---|---|---|---|
| HMO | 116 | 43 | 34 | 6 | 199 | |
| HMO-POS | 10 | 1 | 3 | 0 | 14 | |
| LPPO | 31 | 0 | 0 | 0 | 31 | |
| RPPO | 1 | 0 | 0 | 0 | 1 | |
| Total | 158 | 44 | 37 | 6 | 245 |
LTSS cost trends
As we discussed in our 2019 article,6 we expect the demand for LTSS to increase as the "silver tsunami" reaches older ages. Figure 7 shows the latest view of median annual costs and cost trends in 2019. Trends in the cost of LTSS are influenced by many factors, including the labor supply of health workers, price inflation, and the mix of skill levels of the workers supplying care.
The high 2019 cost trend for home health aides includes the impact of increases to the minimum wage in many jurisdictions.
Figure 7: Median 2019 Annual Costs and Trends of Certain LTSS7
| Description | 2019 Annual cost | Annual cost trend |
|---|---|---|
| Semiprivate room in a nursing home | $90,155 | 1% |
| Home health aide | $52,624 | 5% |
| Care in an adult day healthcare center | $19,500 | 4% |
| Assisted living facility | $48,612 | 1% |
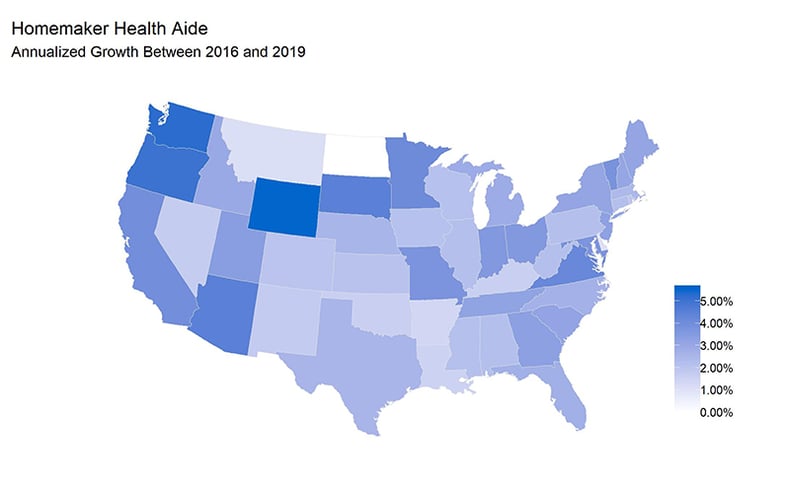
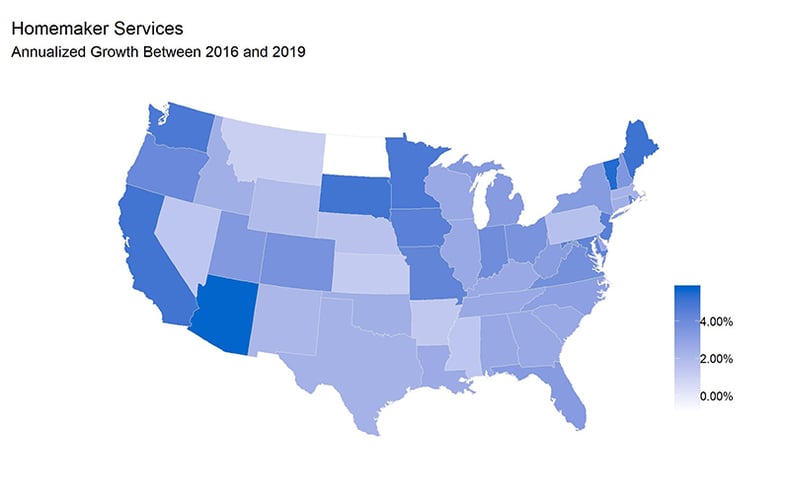
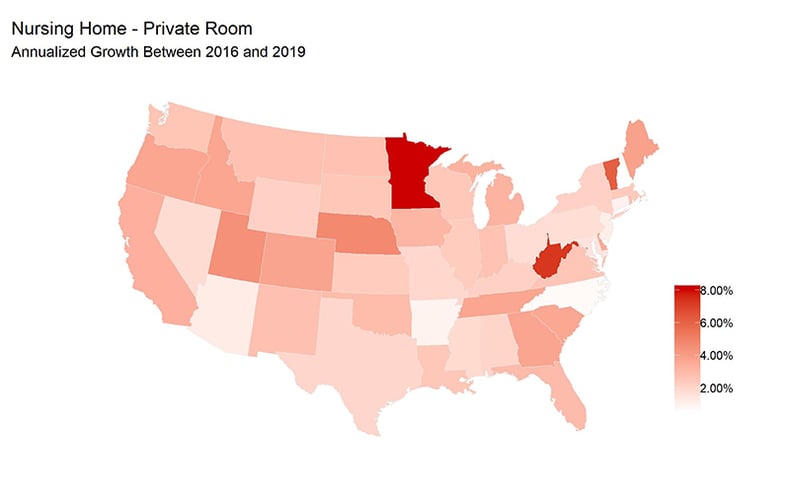
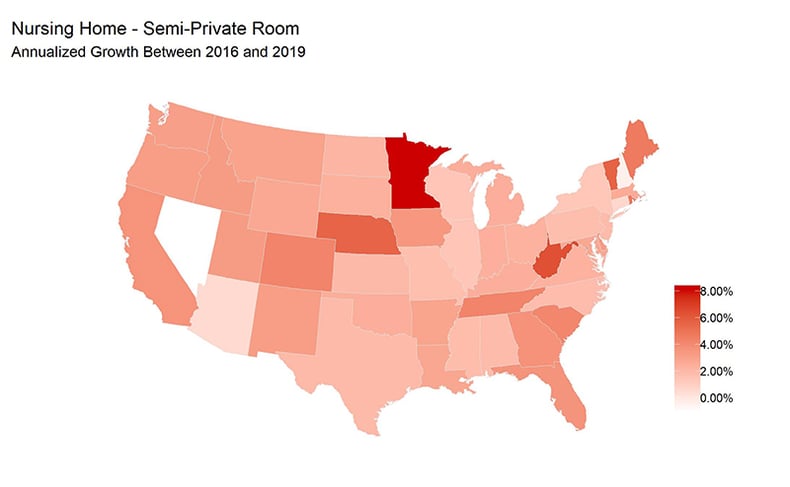
We also reviewed the annual trends in these costs over time by state. Figure 8 shows home health and nursing home annualized cost trends by state from 2016 to 2019. We present these cost trends as they may be helpful for MA plans to consider when offering future LTSS and SSBCI benefits.
Figure 8: Nursing Home and Home Health Care Annual Trends
 |
 |
 |
 |
Conclusion
As this report shows, there continues to be an interest on the part of MA plans in offering LTSS benefits to their members. We anticipate ongoing growth in this area, and we plan to continue monitoring this market as MA plans continue to make inroads in diversifying the types of long-term benefits that could improve the quality of life of their members. There is an opportunity for MA plans to offer more substantial benefits in the future, and we look forward to updating this report accordingly.
1CMS defines these services as those that are “… used to diagnose, compensate for physical impairments, acts to ameliorate the functional/psychological impact of injuries or health conditions, or reduces avoidable emergency and healthcare utilization.”
2Section 1852(a)(3)(D)(ii) of the Bipartisan Budget Act of 2018.
3For CY2020, we focused our survey in benefit 14c, which corresponds to the enhanced supplemental benefit category, in the plan benefit package (PBP). This section of the PBP was modified for CY2020 to include the services in Figure 1 as predefined benefits. On CY2019, we focused our search in benefits 13d, e, and f of the PBP, which represent the “Other Supplemental Services” category of the benefit package.
4The plan benefit package (PBP) tool was modified for CY2020 to include some of these benefits as predefined benefit options under benefit 14c. During CY2019, plans offering these benefits had to use benefits 13d, e, and f, assigned to the “Other Supplemental Benefits.” Benefits entered in 13d, e, and f are user-defined.
5For CY2020, we focused our survey in benefit 19b, which corresponds to the SSBCI package, in the plan benefit package (PBP). This section of the PBP was modified for CY2020 to include the services shown in Figure 1 above as predefined benefits.
6Alcocer, P.L., Eaton, R., & Laboy, P. (February 2019). LTSS Services in Medicare Advantage Plans. Milliman White Paper. Retrieved on November 15, 2020, from https://www.milliman.com/en/insight/ltss-services-in-medicare-advantage-plans.
7Genworth. Cost of Care Survey 2018. Retrieved on November 15, 2020, from https://www.genworth.com/aging-and-you/finances/cost-of-care.html.