For over a decade, the financial sector has been talking about a low interest rate environment. This implies that there used to be a normal interest rate environment. Do recent increased interest rates imply a return to normal, or have we entered a new era of turbulent and volatile interest rates?
In this paper, we explore potential implications of this new environment on interest rate hedging and the measurement of the UFR drag for insurers.
Background
Since the global financial crisis (GFC) of 2007 and 2008, we have seen an almost continuous decline in interest rates, causing financial institutions to focus on the low interest environment and its implications for areas such as valuation, capital management and risk management. In 2022 this all changed. Rising inflation forced central banks around the world to increase their rates, materially impacting insurers’ balance sheets and risk profiles.
This briefing note is the second of a series of three articles where we investigate potential implications for insurance companies of last year’s increasing interest rate environment.
In the first article1 we showed the key developments of interest rates in 2022, and show how these developments impact the level of liability discount rates, considering different extrapolation techniques.
In this paper we zoom in to the effects increased interest rates have had on what is commonly referred to as the “ultimate forward rate (UFR) drag,” discussing the potential implications the current economic environment has on interest rate hedging.
Zooming in on the UFR drag
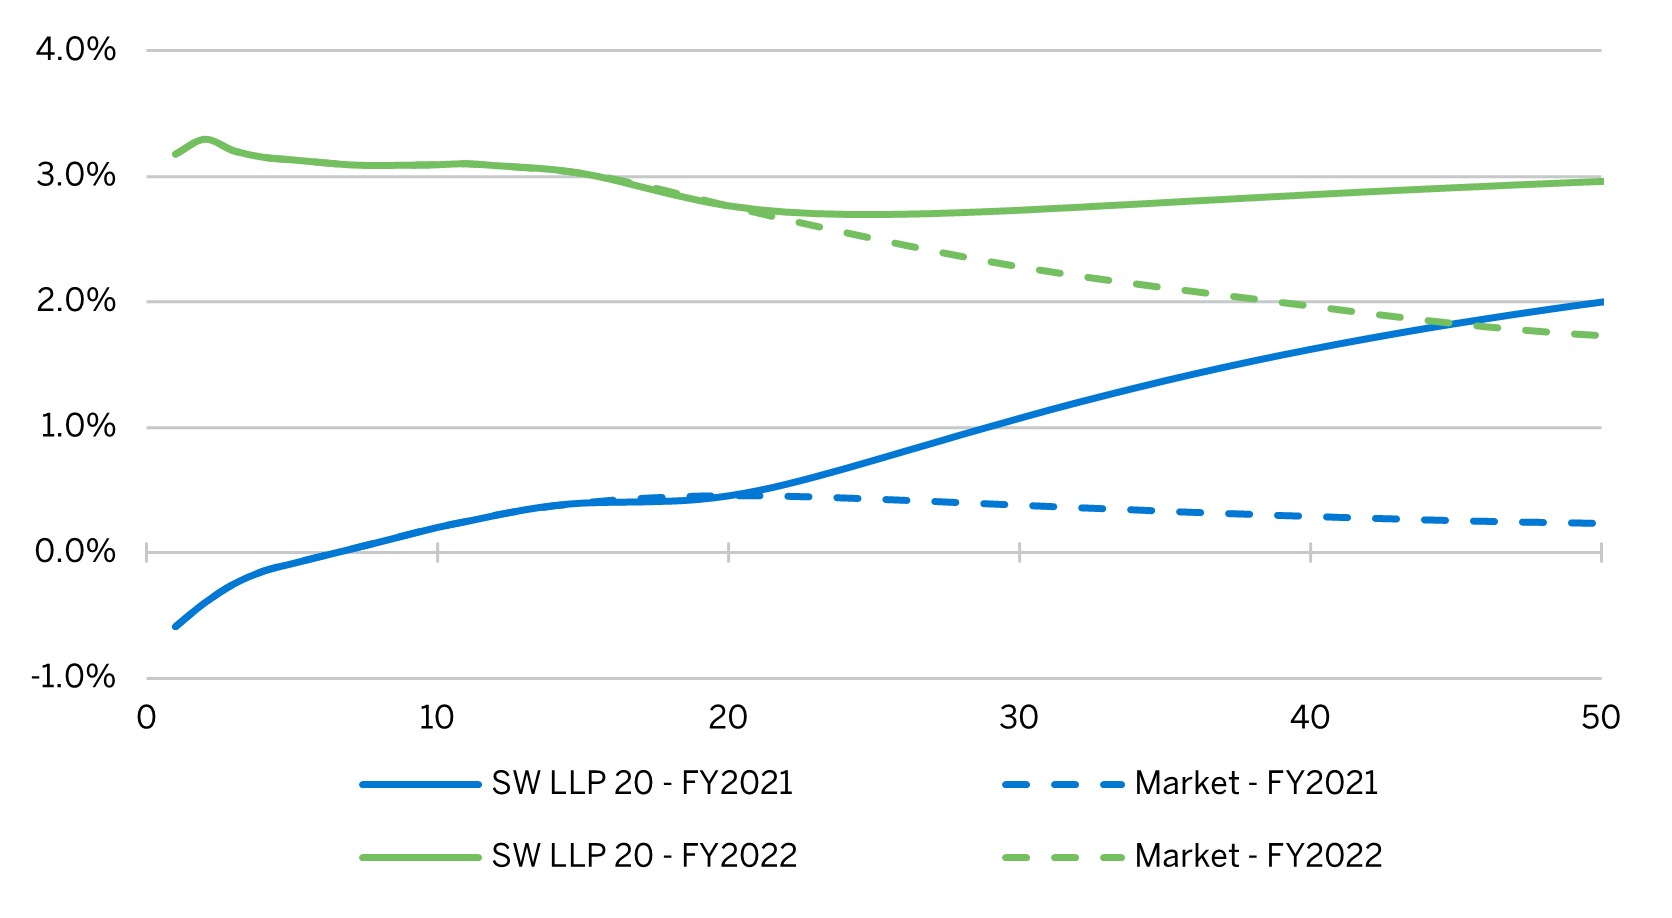
In fiscal year (FY) 2022, a steep increase in market rates followed by a flattening and further inversion of the market curve has been observed, as can be seen from Figure 1.
The increase of the market rates, the inversion of the curve and the extrapolation effect of the changed interest rates have implications for what is commonly referred to as the UFR drag.
The UFR drag is a profit and loss (P&L) impact driven by the difference between the Solvency II (SII) curve and the market curve. The deviation between actual (market) and modelled Solvency II forward rates will manifest over time. At present, with actual forward rates below the UFR, this deviation creates a persistent drag as one rolls down the curve. All other things remaining equal, it will result in a cumulative reduction in an insurers’ own funds.
Figure 1: Liability discount curves at FY2021 and FY2022, including CRA and excluding VA
To understand the effect that the market developments in 2022 have had on the UFR drag, we break down the impact on the UFR drag from 1) the increase in market rates up to 15-year, and 2) the further flattening of the market curve.
Impact on UFR drag resulting from increase of market rates
To isolate the impact on the UFR drag that is caused solely by the increase of the market rates in 2022, we filter out the flattening effect beyond the 15-year rates observed in 2022 from the market curve. This is done by assuming the market rates per year-end (YE) 2022 from year 15 and onwards develop with the same slope and curvature as the market rates per YE2021. This curve is referred to as the “Market FY2022” expected curve and is based on the following construction:
- Up to 15-year term: FY2022 market quotes.
- 20-year+ terms: Shifting corresponding FY2021 market quotes, by the rate change at 15-year term.
The SII FY2022 expected curve is derived by re-extrapolating the curve using liquid terms of the Market FY2022 expected curve.
In Figure 2 a comparison is made between the UFR drag per YE2021 and the expected UFR drag for YE2022 based on the expected development of the market and SII curve.
Figure 2: UFR drag decreases as result of market movements
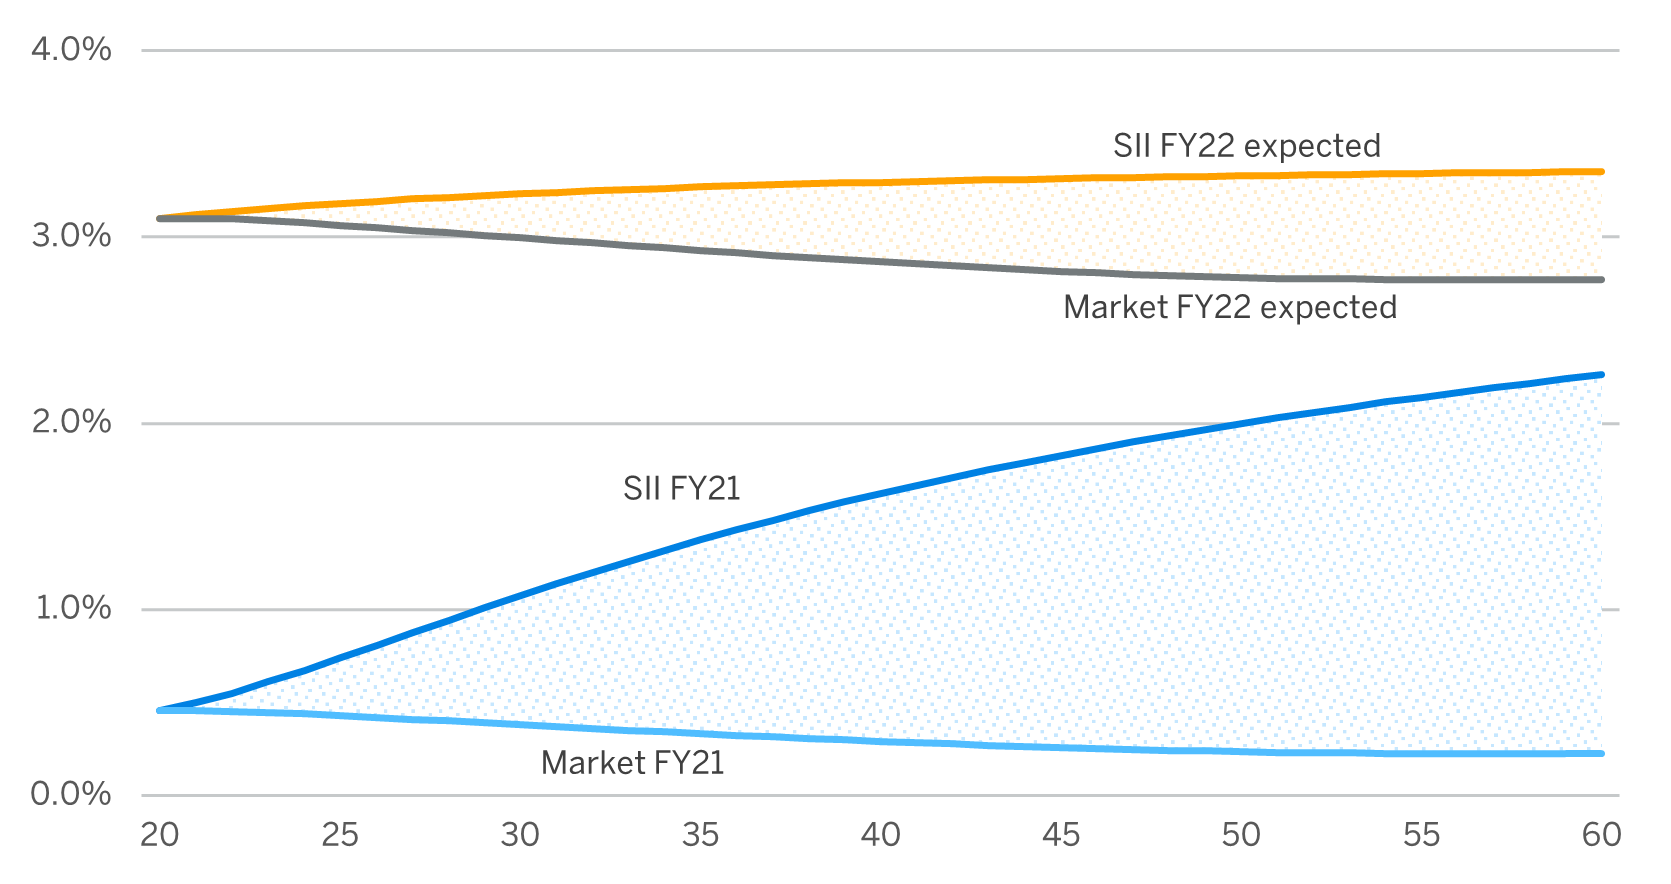
From Figure 2 it can be seen that, considering solely the development of market rates (up to 15-year) between YE2021 and YE2022, the UFR drag decreases as per YE2022 because the market curve is now significantly closer to the SII curve.
Impact on UFR drag resulting from inversion of the market curve
Unlike the situation depicted in Figure 2, in reality the UFR drag has materialised differently from what would be expected, as can be seen from Figure 3. The realised UFR drag (SII FY2022 – Market FY2022) turns out larger than the expected UFR drag (SII FY2022 expected – Market FY2022 expected).
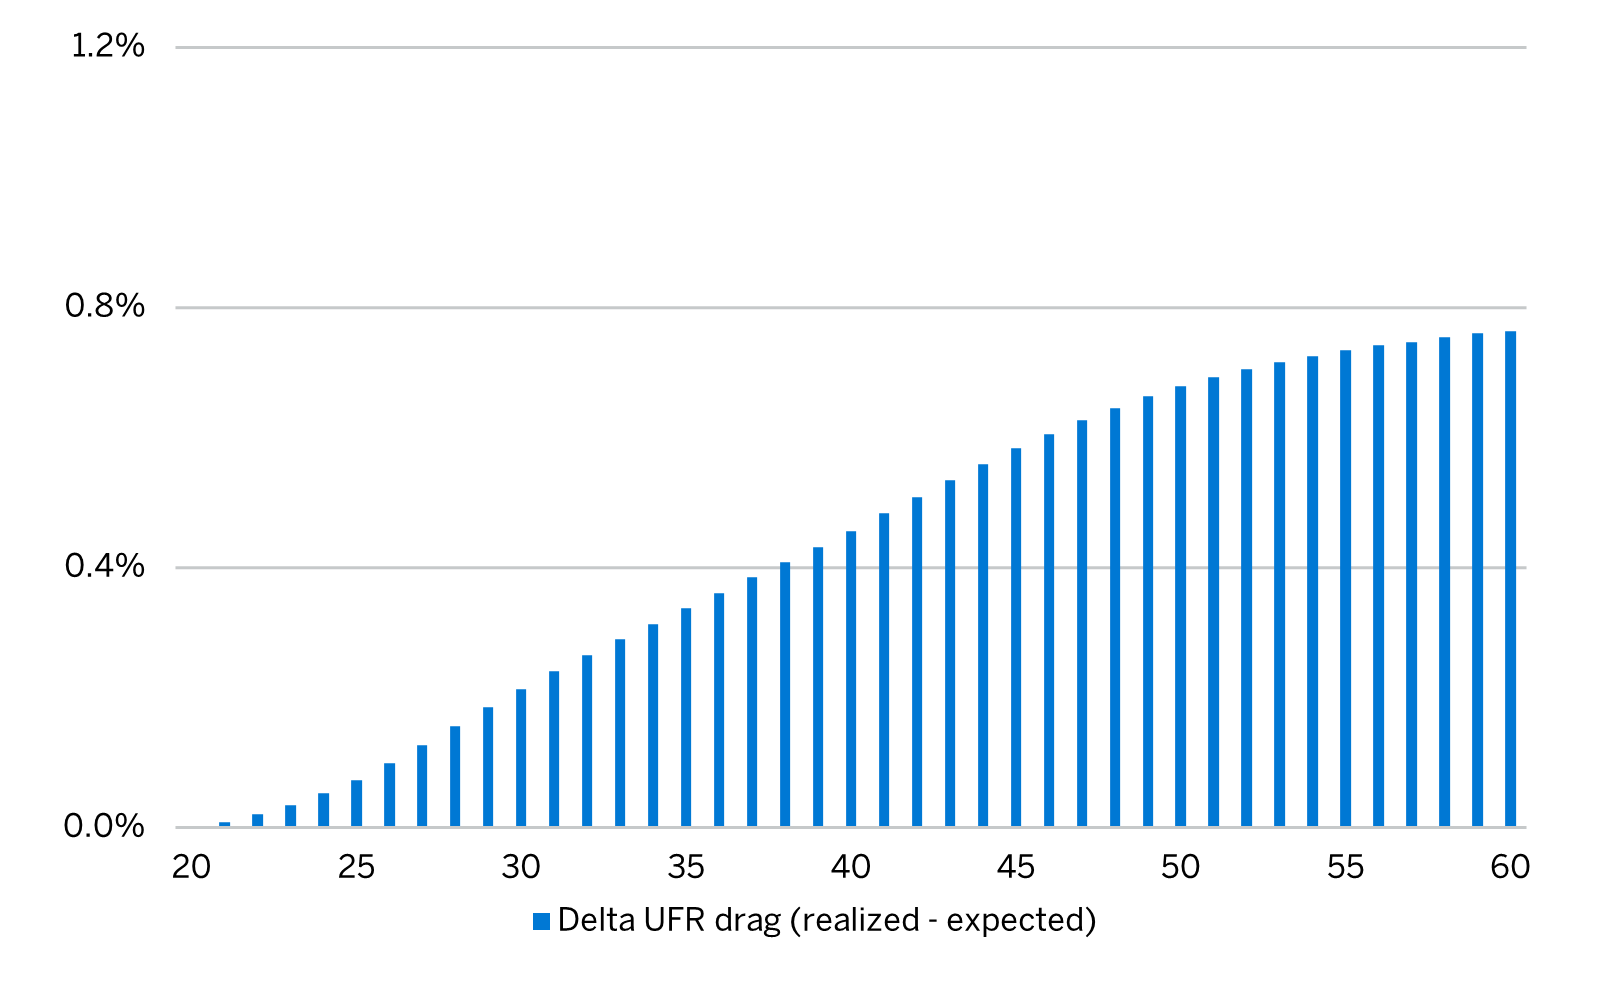
The difference between the actual and expected UFR drag (as quantified in Figure 4) is attributed to the fact that the market curve has further inverted during 2022.
Figure 3: UFR drag changes different from expected
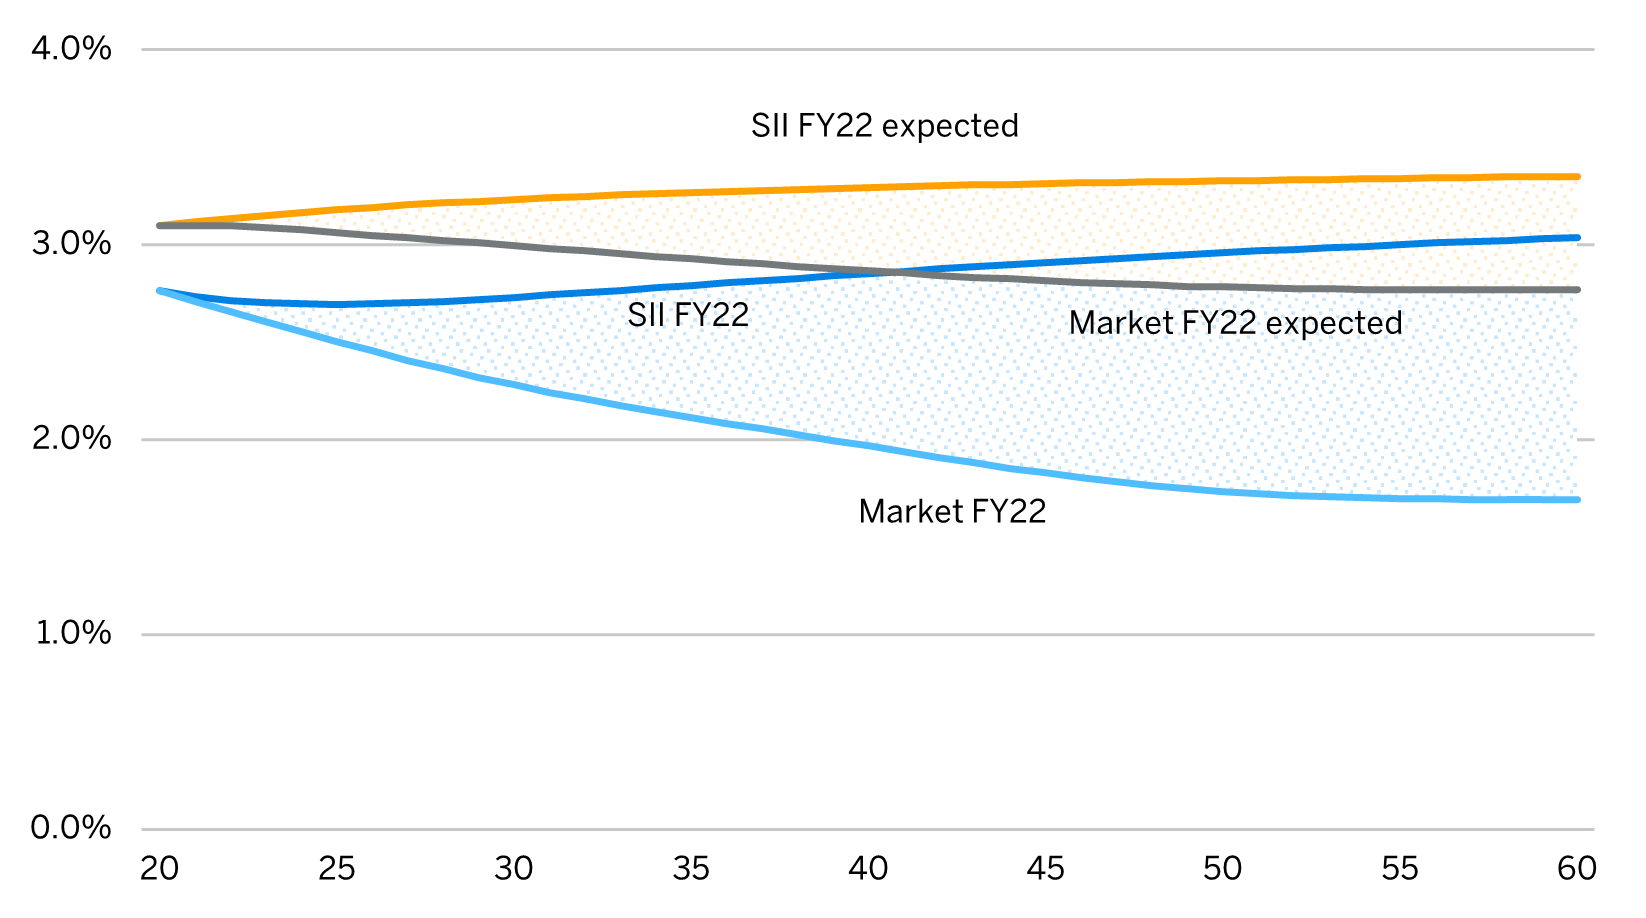
The difference between the actual and expected UFR drag (as quantified in Figure 4) is attributed to the fact that the market curve has further inverted during 2022.
Figure 4: UFR drag materialises differently from expected
However, if we further zoom in on this effect there are actually two separate effects that contribute to the change in the UFR drag, being:
- the further flattening and inversion of the market curve, and,
- the extrapolation effect on the SII curve caused by the flattening of the market curve.
These effects are analysed in more detail below.
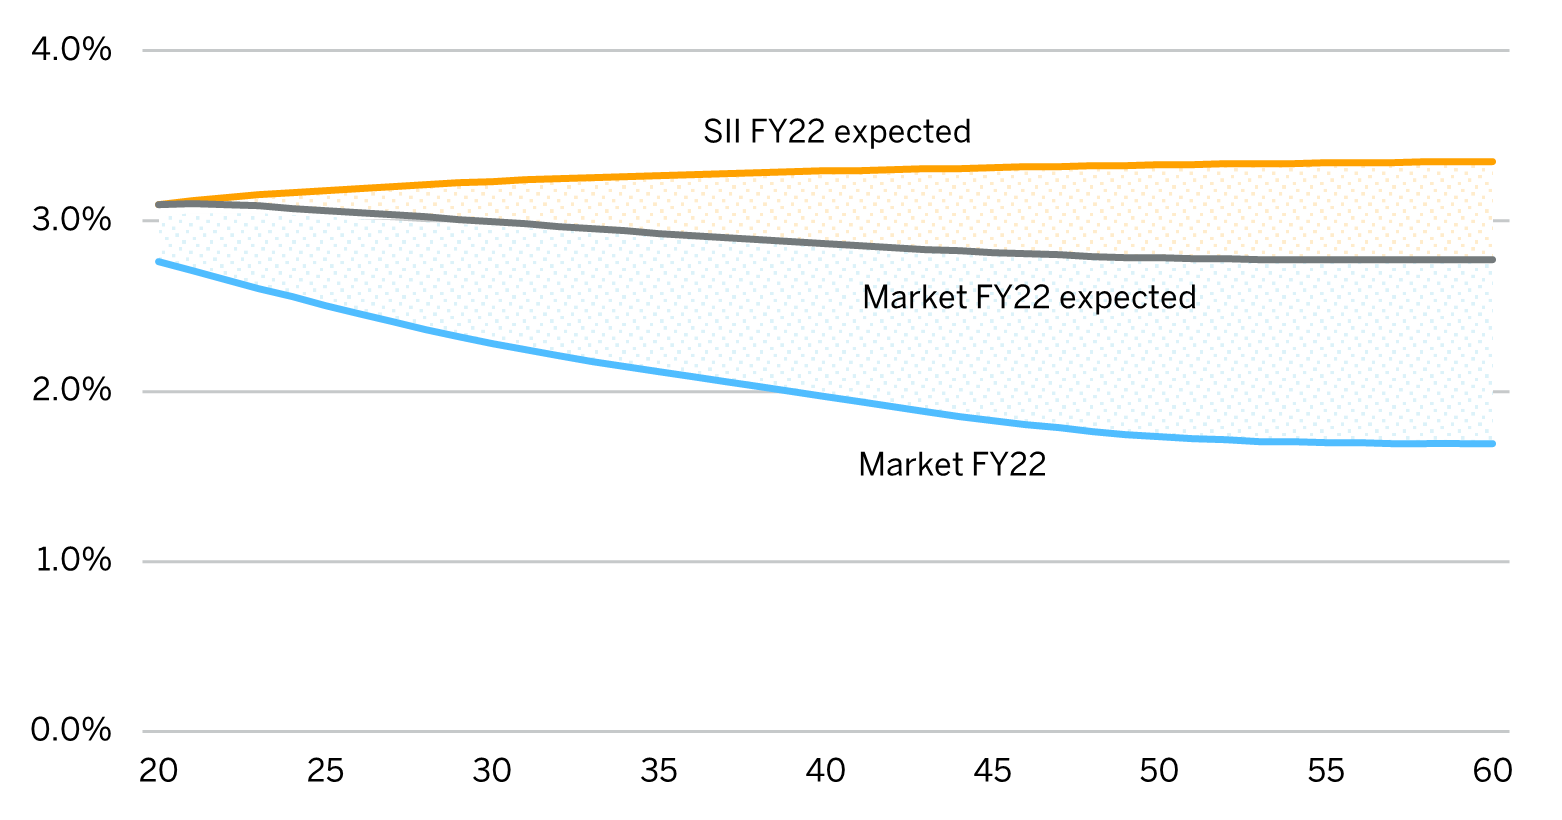
As a result of the further flattening of the market curve, the UFR drag increases as the market curve decreases compared to what was expected. As a result, the gap between the SII (expected) curve and the market curve further widens (as illustrated in Figure 5). The resulting UFR drag (SII FY22 expected – Market FY22) is larger than the expected UFR drag (SII FY22 expected – Market FY22 expected).
Figure 5: additional UFR drag stemming from flattening of the market curve
Extrapolation effect
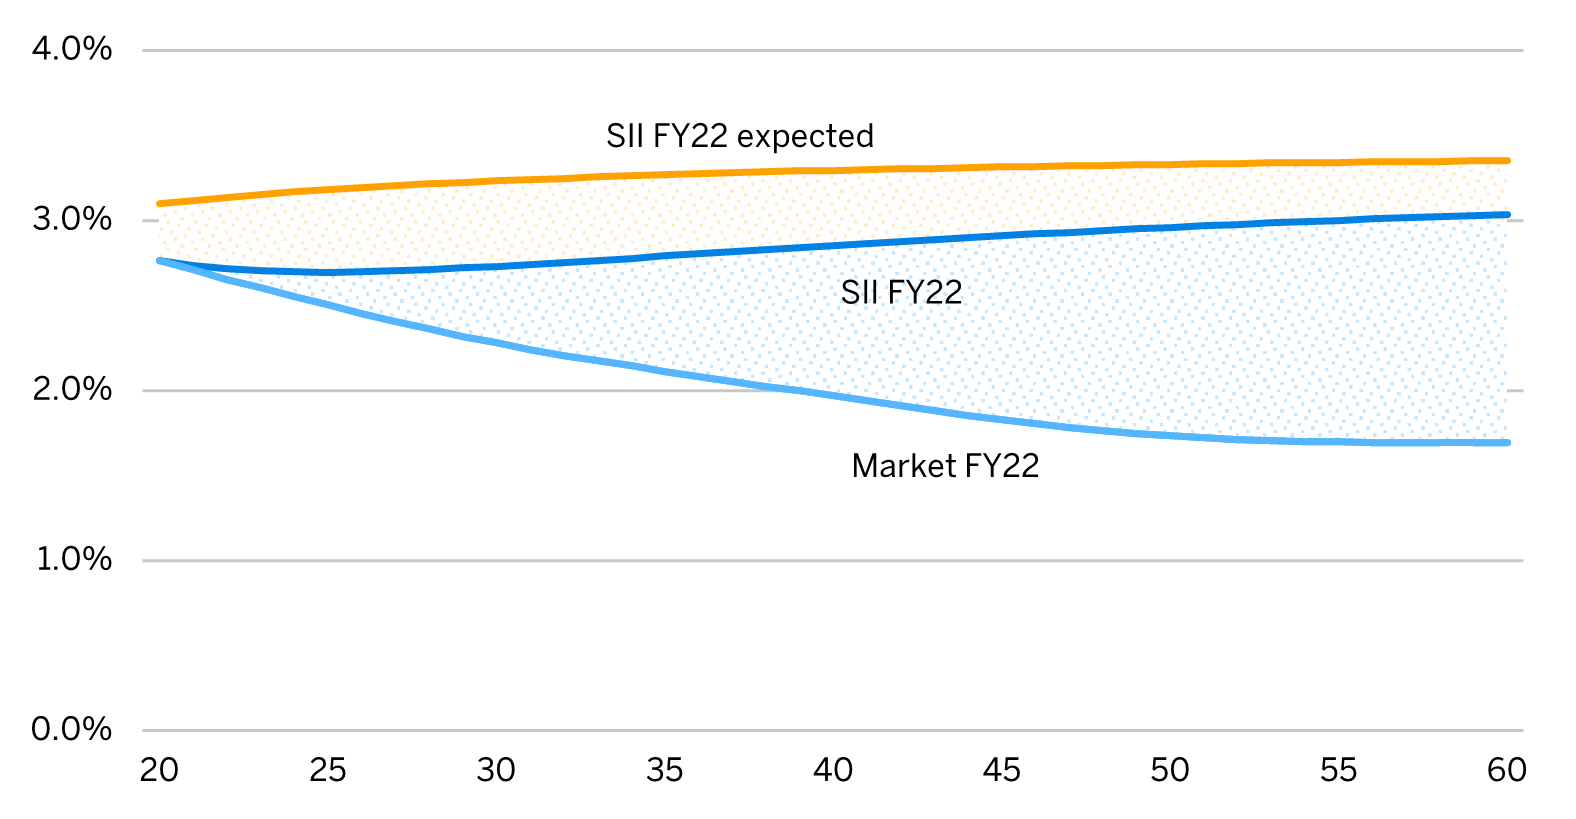
In the extrapolation to the UFR the 15Y and 20Y rate are key drivers for the level and shape of the extrapolated part of SII curve. As previously shown, the 15Y and 20Y rates have further flattened in 2022. The ‘technicalities’ of the Smith-Wilson extrapolation method in conjunction with the flattening of the market curve cause the extrapolated rates to decrease in comparison to the curve that does not include the inversion observed in 2022 as is illustrated from Figure 6.
This causes the UFR drag to decrease but comes at the cost of a lower discount curve. Hence, implicitly part of the UFR drag is taken already in the form of an increase of the present value of the insurance liabilities.
Figure 6: reduction of UFR drag caused by the extrapolation effect
Implications for liability valuation and hedging
In Figure 7, the effects of the market movements observed in 2022 on the UFR drag are illustrated in an analysis of change. For this example, we have used a proxy cash flow, internally constructed, representing an average Dutch life insurance company. The cash flow is calibrated to represent a life insurance liability with duration 16 when applying the Solvency II curve excluding the volatility adjustment (VA).
Figure 7: Analysis of change of UFR drag between FY21 and FY22 (SII BEL at FY2021=100)
| PV BEL market | PV BEL SII | PV UFR drag | Delta UFR drag | |
|---|---|---|---|---|
| BEL | 109,7 | 100 | 9,7 | |
| Market movements | 71,5 | 70,2 | 1,4 | -8,3 |
| Flattening of the market curve | 76,4 | 70,2 | 6,3 | +4,9 |
| Extrapolation effect | 76,4 | 72,9 | 3,6 | -2,7 |
| Delta UFR drag | 6,3 |
Figure 7 illustrates that the standalone effects of the flattening of the market curve and the extrapolation effect have a large impact on the UFR drag, with the flattening of the curve being the most predominant of the two.
From a hedging perspective, hedging the key 15Y-20Y rate would ensure that the effects of the flattening of the curve on both the value of the insurance liabilities and the UFR drag would be limited. This particularly so, given that the interest rate sensitivity of the key interest rates between FY21 and FY22 have not changed materially.
As discussed in previous papers2 , when we quantify interest rate sensitivities, we calculate the key rate DV01 using 1 bp triangle shocks centered at the relevant key rate, with the triangle’s vertices extending to the adjacent key rates. The effects on SII curve per YE21 and YE22 are shown below.
Figure 8: effect of SW extrapolation methodology after shocking the liquid part of the YE2021 curve
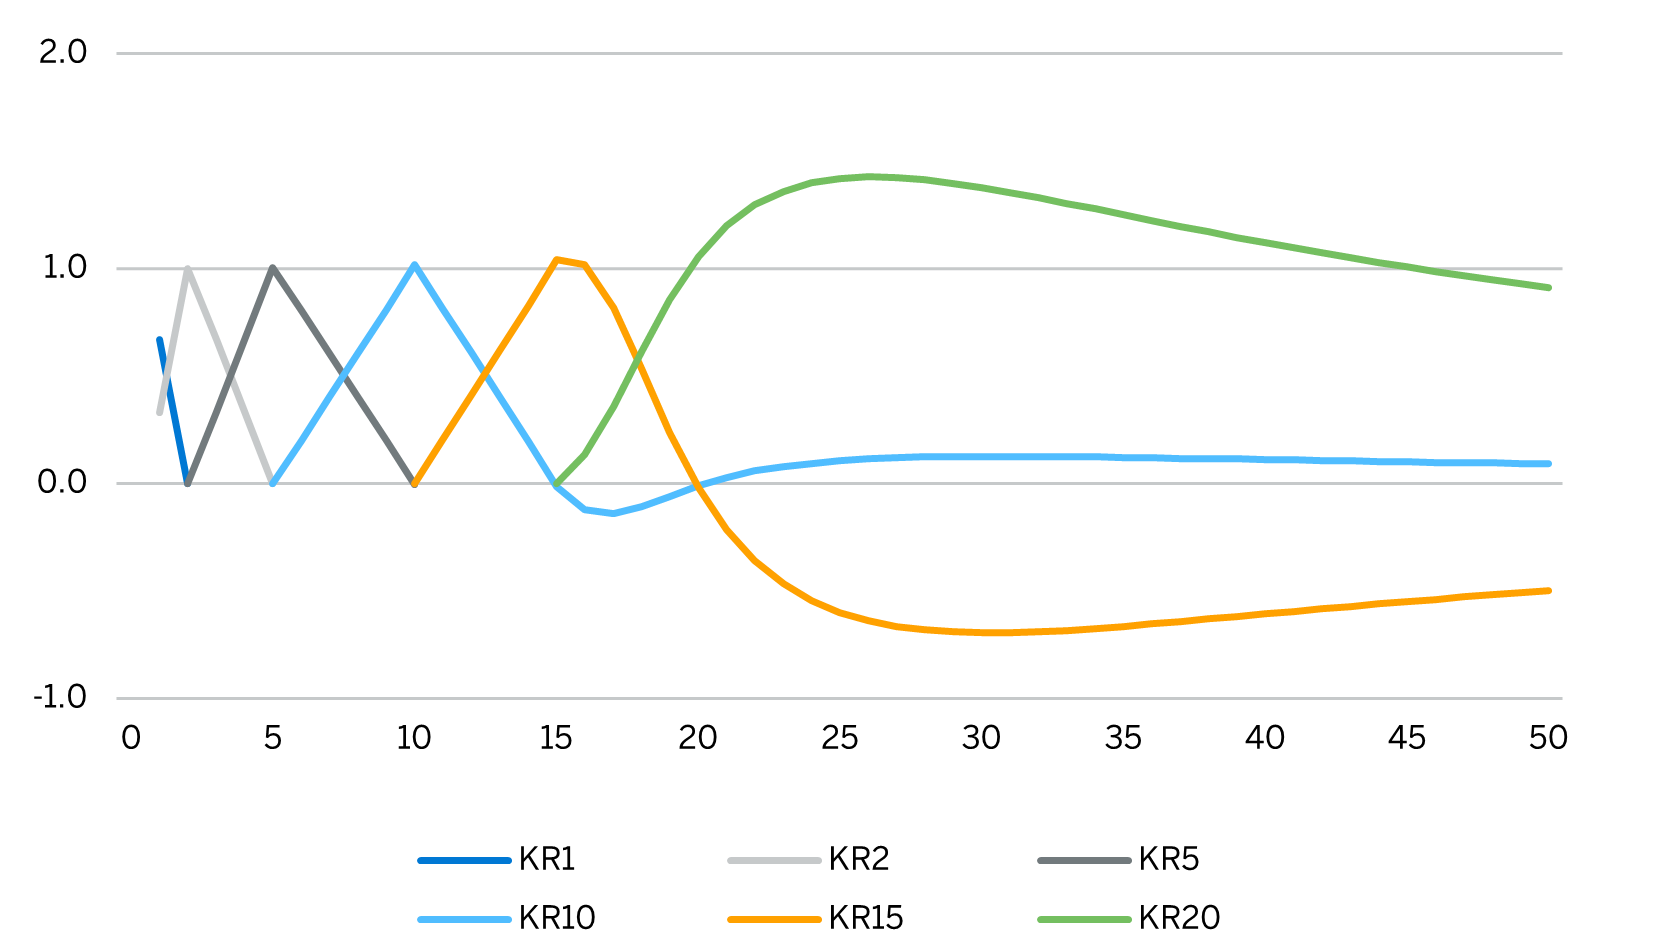
Figure 9: effect of SW extrapolation methodology after shocking the liquid part of the YE2022 curve
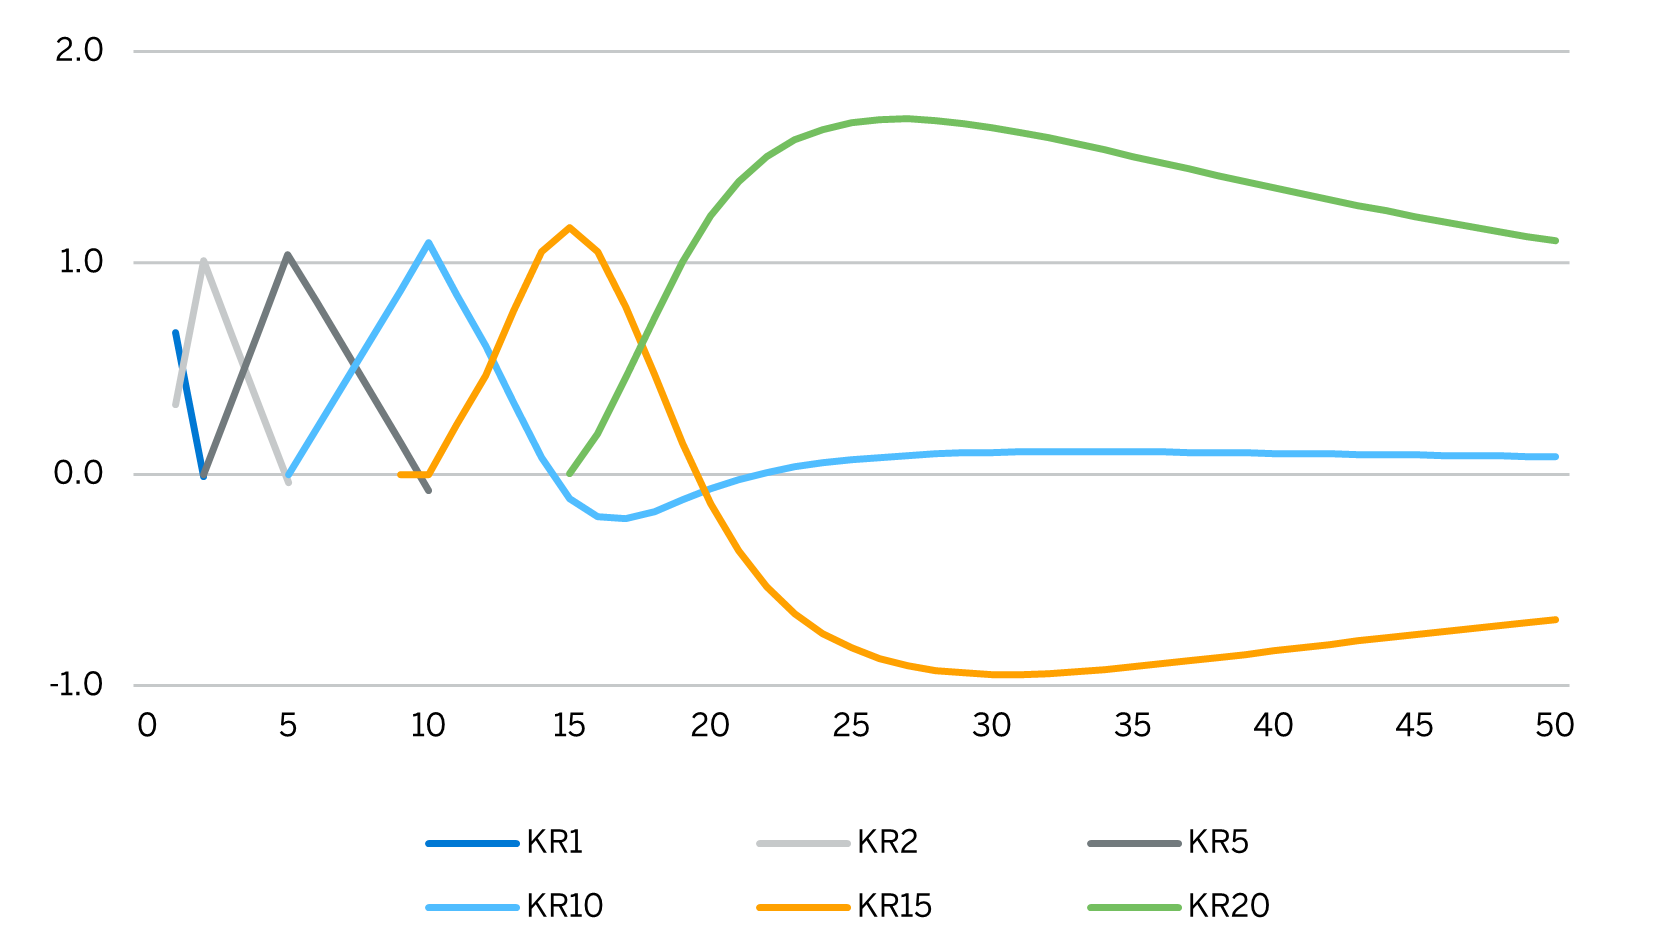
The Figures indicate sensitivities of the key rates remain relatively stable3 indicating that the increase of the interest rates have not had a significant impact on the interest rate sensitivities. The interest rate sensitivity for KR15 and KR20 have magnified slightly. However, it is not expected that this effect will have an impact on the value of the insurance liabilities given the extrapolation effect dampens the interest sensitivity.
Conclusions
The year 2022 has put an end (for the time being) to the low interest rate environment. Insurers are facing new challenges in achieving effective interest rate risk management. Choices in hedging made during times of low interest rates are now materializing.
In this paper we have shown that changes to the UFR drag are not solely driven by the change in market rates. Changes in the level and slope of the market rates in combination with a second order extrapolation effect causes interesting dynamics with respect to the UFR drag and pose challenges in terms of risk management. When key rates were effectively hedged insurers would now have fully captured the benefits from a strong reduction of the UFR drag.
The low (and sometimes even negative) rates that were experienced prior to 2022 are (based upon the current economic outlook) expected to be absent in the foreseeable future. The question is how this new reality — and the speed at which the transition towards this new reality took place — will affect insurers’ understanding of interest rate risk in the broader sense. In our third paper, we will also plan to explore the potential impacts of this new environment on economic scenarios, appropriateness of the SCR, and stress and sensitivity testing.
1See https://www.milliman.com/en/insight/new-interest-rate-environment-back-to-normal
2See, for example: https://nl.milliman.com/-/media/milliman/pdfs/2020-articles/london-solvency-ii/10-5-20-solvency-ii-hedging-v1.ashx